

The Rise & the Fall of the ICOs: Complete ICO Analysis 2013-2018
ICO aims at disrupting both traditional venture capitalism as well as expanding the broadness of cryptocurrencies beyond that of just Bitcoin. The ICO trend got humongous attention in 2017, a lot of companies both successful and unsuccessful went for the ICO and raised a huge amount of capital through this source of funding. Although the start of this year was favorable towards the ICO industry yet almost 46% of the ICO’s failed in 2017 with a lot of regulatory compliance started to emerge in the industry. Sit tight for the complete and overall ICO analysis for this year.
History of ICO
The idea of ICO was first proposed in a Bitcoin Talk by Jeff Willet, here is a small extract of his proposed idea.

“If you wanted to, today, start a new protocol layer on top of Bitcoin, a lot of people don’t realize, you could do it without going to a bunch of venture capitalists and instead of saying, hey, I’ve got this idea, you can — you’re familiar with Kickstarter I assume? Most of you?
You can actually say, okay, here’s my pitch, here’s my group of developers — there’s a lot of developers in this room. If you get a bunch of trustworthy guys together that people have heard of and say, okay, we’re going to do this. We’re going to make a new protocol layer.
It’s going to have new features X, Y, and Z on top of bitcoin, and here’s who we are and here’s our plan, and here’s our bitcoin address, and anybody who sends coins to this address owns a piece of our new protocol. Anybody could do that.
And I’ve been telling people this for at least a year now because I want to invest in it. I don’t have a ton of coins, but that’s where I want to invest my coins. And I’ve yet to find somebody who wants my coins. Does anybody in this room want my bitcoins, because I want to.”
The first ICO was held by Mastercoin in July 2013 led by Jeff Willet. Later Ethereum raised money with a token sale in 2014 raising 3700 BTC in its first 12 hours, which was approximately $2.3 Million at the time.
In May 2017, Brave a web browser which provided a platform decentralized application raised about $35 Million in under 30 seconds!
In September Kik a messaging app raised $100 Million through ICO. By the end of October 2017, the ICO industry was worth $2.3 Billion, which was more than 10 times in 2016. In January 2018 Filecoin raised $257 Million, of which $200 Million was raised in the first hour of the token sale.
But the trend eventually started declining. On February 23, 2018, Bitcoin.com reported that 46% of them are effectively dead already – despite raising over $104 million.
Complete Analysis of ICO in 2018
ICO Analysis by Geographical Location
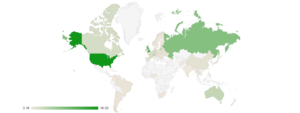
Image and Data Source:icowatchlist.com
| Country | % Of Projects | Total Raised |
| United States | 16.02% | $829,492,219 |
| United Kingdom | 10.36% | $131,041,953 |
| Russian Federation | 7.61% | $1,830,004,024 |
| Singapore | 7.12% | $313,182,830 |
| Switzerland | 6.80% | $514,775,825 |
| Estonia | 4.21% | $34,717,899 |
| Australia | 3.24% | $30,500,000 |
| Hong Kong | 3.07% | $31,407,016 |
| Gibraltar | 2.43% | $117,480,000 |
| Lithuania | 2.27% | $54,050,000 |
| Germany | 2.10% | $6,350,000 |
| France | 1.94% | $78,050,000 |
| Canada | 1.94% | $20,380,000 |
| Israel | 1.46% | $167,370,000 |
| Spain | 1.13% | $26,660,000 |
| China | 0.97% | $207,873,200 |
| Ukraine | 0.97% | $745,940 |
| Poland | 0.81% | $8,600,000 |
| Slovenia | 0.65% | $896,240 |
| Panama | 0.65% | $20,000,000 |
| Isle of Man | 0.49% | $35,000,000 |
| Liechtenstein | 0.49% | $24,990,000 |
| Taiwan | 0.49% | $13,078,406 |
| Argentina | 0.49% | $26,290,000 |
| Costa Rica | 0.32% | $110,000 |
| Serbia | 0.32% | $53,070,000 |
| Austria | 0.32% | $5,400,000 |
| Luxembourg | 0.32% | $5,160,000 |
| Republic of Korea | 0.16% | $36,241,600 |
| Sweden | 0.16% | $14,800,000 |
| Slovakia | 0.16% | $9,410,000 |
| Myanmar | 0.16% | $10,500,000 |
If we go by the geographical demographics, the United States has dominated the ICO market by 16.02%, followed by the United Kingdom at 10.36% and Russia at 7.61%. The adoption of the ICO model talks a lot about the way people are raising funds. It shows that people have moved from the traditional funding method of Venture Capitals. The new way of crowdfunding has liberalized how entrepreneurs approached for capital.
The country with the highest percentage of adoption shows that people from that area are more technically sound and are comfortable raising their funds through ICO.
ICO Analysis by Industry
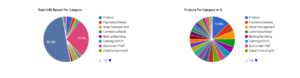
Image and Data Source:icowatchlist.com
| Category | % Of Projects | Total Raised |
| Network/Communications | 2.67% | $4,640,447,641 |
| Blockchain Platform | 4.55% | $2,537,284,628 |
| Finance | 12.87% | $428,055,006 |
| Drugs/Health | 3.61% | $245,108,999 |
| Payments/Wallets | 6.12% | $229,755,940 |
| Content/Advertising | 2.98% | $113,700,000 |
| Social Network | 1.88% | $112,110,000 |
| Commerce/Retail | 5.81% | $110,490,000 |
| Energy/Utilities | 1.88% | $90,000,000 |
| Gaming/AR/VR | 4.71% | $89,872,361 |
| Media/Content | 4.08% | $89,490,000 |
| Data/Computing/AI | 4.55% | $83,420,000 |
| Asset Management | 5.81% | $72,916,240 |
| Security/Identity | 3.14% | $62,560,000 |
| Funding/VC | 3.14% | $58,400,000 |
| Prediction Market | 4.08% | $55,280,000 |
| IoT | 4.08% | $53,638,616 |
| Jobs/Marketplace | 2.83% | $37,970,000 |
| Entertainment | 3.77% | $36,580,000 |
| Industry/Logistics | 2.35% | $23,829,663 |
| Betting/Gambling | 4.71% | $19,030,000 |
| Real Estate | 2.83% | $14,410,000 |
| Education | 1.26% | $13,900,000 |
| Insurance | 1.26% | $7,397,480 |
| Music/Arts | 0.31% | $1,360,000 |
There are two components for the comparison. The total USD raised per category talks about how much fund a particular sector is able to raise in USD. The projects per category in percentage talks about what is the contribution of a particular sector as compared to other sectors in terms of projects.
Although Network Communications contributed only 2.67% when it comes to project per category in percentage, however, the capital raised in USD by this sector was the maximum amounting to $4,640,447,641. This shows that even the contribution in terms of the project is lower in Network Communications, however, the capital required in the sector is huge as compared to other sectors.
ICO Analysis by Blockchain Platforms
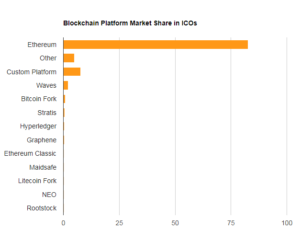
Image and Data Source:icowatchlist.com
| Platform | Market Share |
| Ethereum | 82.57% |
| Other | 4.87% |
| Custom Platform | 7.69% |
| Waves | 2.20% |
| Bitcoin Fork | 0.78% |
| Stratis | 0.47% |
| Hyperledger | 0.31% |
| Graphene | 0.31% |
| Ethereum Classic | 0.16% |
| Maidsafe | 0.16% |
| Litecoin Fork | 0.16% |
| NEO | 0.16% |
| Rootstock | 0.16% |
This data represents the ICO projects that are grouped based on the underlining blockchain technology with which the project’s tokens were developed. Ethereum is the one who introduced Smart Contracts. This is one of the reasons it gained a lot of attention from the developers.
Just like a traditional contract where two counterparties are coming together over a general agreement over something. A Smart Contracts provides the feature of a contract getting executed when specific terms defined on the contract are successfully executed. But a Smart Contract uses an algorithm in order to verify and validate a contract.
This feature made the Ethereum Blockchain one of the most advanced Blockchain ever. This is the reason a lot of projects decided to choose Ethereum as the base layer for their project.
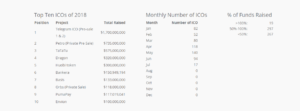
ICO Analysis by Year
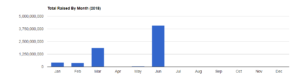
Image and Data Source:icowatchlist.com
| ICO Name | Month | Total Raised |
| EOS | Jun | $4,100,000,000 |
| Telegram | Mar | $1,700,000,000 |
| tZERO | Jan | $250,000,000 |
| Elastos | Jan | $94,073,200 |
| LeadCoin | Mar | $50,000,000 |
| ArcBlock | Feb | $45,000,000 |
| Nucleus.Vision | Feb | $40,000,000 |
| WePower | Feb | $40,000,000 |
| FuzeX | Feb | $36,241,600 |
| Shivom | May | $35,000,000 |
| Tradove | Feb | $33,000,000 |
| Jet8 | Mar | $32,700,000 |
| Trade.io | Jan | $31,000,000 |
| EnergiToken | Feb | $26,000,000 |
| Apex | Feb | $25,000,000 |
| Storiqa | Jan | $25,000,000 |
| MedicalChain | Mar | $23,991,953 |
| Uservice | Feb | $23,829,663 |
| Ocean protocol | Mar | $22,100,000 |
| BABB | Feb | $20,000,000 |
| Kind Ads | Jan | $20,000,000 |
| GoChain | May | $18,209,475 |
| Lympo | Feb | $16,857,899 |
| Galaxy eSolutions | Mar | $14,000,000 |
| Kora Network | Jun | $12,000,000 |
| LiveEdu | Jan | $10,500,000 |
| LikeCoin | May | $5,407,016 |
| Blocklancer | Feb | $5,400,000 |
| Total | 2018 | $6,755,310,806 |
Here the projects are grouped by the month and calendar year of ICO campaign execution. The ICO analysis done here is through the projects that are displayed in the graphical representation and the amounts raised are also indicated on a monthly basis.
You can use this as a trend tracker and to also take note of the seasons of capital flow into cryptocurrency projects. Additionally, it can be used as a Return on Investment (ROI) guide.
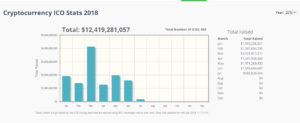
Image and Data Source:coinschedule.com
This graph also shows the total capital raised by the ICO market for this month, with January, February and March was the time for Telegram with its ICO.
Data Source:coinschedule.com
Telegram raised a staggering $1.7 Billion through its ICO in the first 3 months itself, which was followed by a pre-sale 1 and 2 respectively.
Published and Unpublished results of ICO 2018
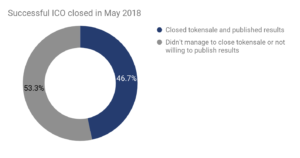
Image and Data Source: cointelegraph.com
This statistic of the ICO analysis throws light on the responsiveness of the ICO’s. Only 46.7% of the ICO’s have disclosed and published their results and data which is vital for investors. The other half talks about the ICO’s that are either not delivering on the promises made by them or their project is not keeping up with deadlines.
The Future of ICO
Although the concept of raising capital in the form of ICO is a lot controversial today, one of the examples is the ICO of Tezos, which went through multiple lawsuits. Such issues are expected to arise because ICO’s are still in the infant stage of development and growth.
ICO is not the only option companies and enterprises are moving to. Security Token Offerings (STO) is something many big companies are leaning towards this new form of raising capital.
STO is a token which is backed by a real asset, profits or company revenue. Venezuelan government’s oil-backed Petro coin is a good example of STO. These coins are meant to operate more like traditional securities and to meet all the requirements of the Securities and Exchange Commision(SEC).
Vitalik Buterin is also proposing new forms of crypto crowd sales like DAICO, Interactive Coin Offerings, and Continuous Token Models.
Such emerging development in the decentralized crowdfunding technology and platforms will give rise to a lot of enterprises and startups with better funding solutions and at the same time providing investors with more transparency and better security solutions.
Image Source for the featured image: hackernoon.com
Disclaimer: The opinions presented here are of the Authors. Readers should do their own due diligence before taking any actions related to the promoted company or any of its affiliates or services. CoinScenario.com is not responsible, directly or indirectly, for any damage or loss caused or alleged to be caused by or in connection with the use of or reliance on any content, goods or services mentioned in the press release.